

Technical Analysis for Intraday Trading: A Complete Guide for Stocks & Crypto
In both stock and crypto markets, intraday trading — buying and selling within the same trading day — has become hugely popular. But quick profits only come to those who understand technical analysis: the language of price.
This guide is your complete roadmap — covering the core tools, patterns, indicators, strategies, and execution mindset you need to master intraday technical analysis in both stocks and cryptocurrencies.
Whether you’re a beginner or intermediate trader, this article will give you clarity, structure, and an edge in markets.
Table of Contents
What is Technical Analysis?
Why Technical Analysis is Essential for Intraday Trading
Candlestick Patterns: The Foundation
Timeframes: Picking the Right Chart for Intraday
Trend Identification & Market Structure
Support & Resistance Levels
Volume – The Hidden Confirmation Tool
Key Technical Indicators for Intraday
Combining Indicators for High-Probability Trades
Chart Patterns Every Trader Should Know
Entry & Exit Rules
Risk Management for Intraday
Differences Between Stocks and Crypto Technical Analysis
Common Mistakes & How to Avoid Them
Conclusion
1. What is Technical Analysis?
Technical analysis is the study of past price movements to predict future price behavior.
It assumes:
🎯 Price discounts everything
🎯 Price moves in trends
🎯 History often repeats itself
Unlike fundamental analysis (which looks at intrinsic value), technical analysis focuses on:
Price charts
Patterns
Indicators
Volume
Trendlines
It is macro-agnostic — meaning it works across stocks, crypto, forex, commodities, and more.
2. Why Technical Analysis is Essential for Intraday Trading
Intraday trading moves fast — you don’t have time to read annual reports, fundamental news, or earnings statements.
You need a system that tells you:
When to enter
When to exit
Where to set stop-loss
How much risk you are taking
When to stay out
Technical analysis provides all this guidance.
It’s not guesswork.
It’s pattern recognition combined with probability.
3. Candlestick Patterns: The Foundation of Intraday
Candlesticks aren’t just pretty visuals — they reflect psychology.
Each candle shows:
✔ Opening price
✔ Closing price
✔ High
✔ Low
✔ Market sentiment
Bullish Candlestick Patterns
🟩 Hammer – Bullish reversal after a drop
🟩 Bullish Engulfing – Buyers overwhelm sellers
🟩 Morning Star – Trend-reversal signal
Bearish Candlestick Patterns
🟥 Shooting Star – Trend reversal potential
🟥 Bearish Engulfing – Sellers dominate
🟥 Evening Star – Bearish signal after uptrend
Candlesticks help you see who is winning — bulls or bears.
4. Timeframes: Picking the Right Chart for Intraday
Intraday traders don’t use daily charts — they use:
📉 1-Minute
📈 5-Minute
📊 15-Minute
📈 30-Minute
Why?
Because intraday trading requires finding and reacting to short-term momentum, not long-term patterns.
👉 Best practice:
Use multiple timeframes:
15m for structure
5m for entry/exit
1m for fine execution
5. Trend Identification & Market Structure
Trend is your friend — but only if you can identify it in real time.
Uptrend Structure
✔ Higher highs
✔ Higher lows
Downtrend Structure
✔ Lower highs
✔ Lower lows
Sideways Market
✔ No clear trend
✔ Range‐bound movement
Knowing where the market stands helps avoid:
❌ False breakouts
❌ Late entries
❌ Emotional trading
6. Support & Resistance: The Trading Grid
Support & resistance are horizontal price levels where behavior often repeats.
🎯 Support: Price level where buyers step in
🎯 Resistance: Price level where sellers step in
In intraday trading, these are key decision zones.
How to find them:
✔ Previous swing highs/lows
✔ Congestion zones
✔ Round numbers (e.g., 100, 1000)
✔ Psychological levels
When price approaches these zones, watch for:
✔ Rejection patterns
✔ Breakouts with volume
✔ Retests after breakout
7. Volume – The Confirmation Tool
Price without volume is like a ship without wind.
Volume tells you whether a move has real support.
✔ Rising price + rising volume = strong move
✔ Rising price + falling volume = weak move
For intraday, volume spikes often explain:
➡ Breakout validity
➡ Trend continuation
➡ Exhaustion moves
Always check volume before acting.
8. Key Technical Indicators for Intraday
Indicators are mathematical tools that help confirm trends and signals.
🔹 Moving Averages (MA)
✔ Simple Moving Average (SMA)
✔ Exponential Moving Average (EMA)
Why use them?
Trend identification
Dynamic support/resistance
Filtering noise
For intraday:
👉 9 EMA & 21 EMA crossover is popular
🔹 Relative Strength Index (RSI)
RSI measures momentum.
Above 70 = Overbought
Below 30 = Oversold
Traders use RSI to time reversals and avoid buying at peaks.
🔹 MACD (Moving Average Convergence Divergence)
MACD shows trend changes and momentum shifts.
Look for:
✔ Crossovers
✔ Histogram momentum increase
✔ Divergence
🔹 Bollinger Bands
These bands show volatility.
Price at upper band = possible resistance
Price at lower band = possible support
Band squeezes often signal breakout potential.
9. Combining Indicators for High-Probability Trades
No indicator alone gives perfect signals.
The most effective systems combine:
✔ Trend identification
✔ Momentum confirmation
✔ Volume confirmation
✔ Price action signal
Example system:
Identify trend using EMA
Confirm setup with RSI
Validate entry with volume spike
Enter at support/resistance retest
This layered approach increases probability areas and reduces false signals.
10. Chart Patterns Every Trader Should Know
Patterns in charts reveal probability zones.
🔹 Triangles
Symmetrical
Ascending
Descending
Breakouts from triangles often lead to strong moves.
🔹 Double Tops & Bottoms
Double Top = Bearish reversal
Double Bottom = Bullish reversal
These show exhaustion and shift in control.
🔹 Head and Shoulders
A reliable reversal pattern.
✔ Left shoulder
✔ Head
✔ Right shoulder
✔ Neckline breakout signals trend change
🔹 Flags and Pennants
Short consolidation during strong trend.
They indicate continuation — not reversal.
11. Entry & Exit Rules for Intraday Trading
Trading signals are nothing without execution rules.
Here’s a practical intraday entry framework:
✅ Entry Conditions
✔ Price near support/resistance
✔ Momentum confirmation (indicator)
✔ Volume signal
✔ No news event at entry time
🚫 Avoid Entries If:
✘ Trend unclear
✘ Low volume
✘ During major news release
✘ Before market close
📍 Exit Rules
✔ Target = last swing high/low
✔ Stop-loss = below breakout point
✔ Trailing stop if price moves strongly
12. Risk Management for Intraday
Technical analysis is useless without risk control.
❗ Recommended Risk Rules
✔ Risk only 1–2% of trading capital per trade
✔ Use stop-loss on every trade
✔ Calculate position sizing before entry
✔ Never risk large portions after loss
Why?
Because losing trades will happen.
A good risk system turns losses into learning — not account wipeouts.
13. Differences Between Stocks & Crypto Technical Analysis
Although fundamentals differ, technical analysis applies similarly.
✅ Stock Intraday
✔ Markets open/close
✔ Volume spikes tied to news
✔ Regulated environment
🔄 Crypto Intraday
✔ 24/7 trading
✔ Higher volatility
✔ Global liquidity flows
In crypto:
✔ Breakouts happen fast
✔ Reversals can be steep
✔ News impacts more severely
Therefore:
Use tighter stops in crypto
Confirm moves with volume
Avoid emotional chase of sudden spikes
14. Market Hours & Execution Psychology
Stock markets have set hours:
📈 Pre-Open
📉 Opening Bell
📊 Market Session
🔔 Close
Volume patterns in stocks:
Opening spike
Mid-session calm
Closing volatility
Crypto has no hours — which means anyone can trade anytime.
This makes discipline and execution psychology more important in crypto.
15. Practical Intraday Strategies
Below are battle-tested intraday systems:
15.1 EMA Crossover Strategy
Use 9 EMA and 21 EMA
Buy when 9 EMA crosses above 21 EMA
Confirm with RSI above 50
Exit at next resistance
15.2 Range Breakout Strategy
Identify high & low of the first hour
Trade breakout above/below
Stop-loss inside range
Volume must confirm move
15.3 Crypto Volatility Scalping
Use 1-min & 5-min timeframes
Enter on momentum break
Tight stops with quick profit exits
Exit on candle reversal pattern
16. Common Mistakes Intraday Traders Make
🔹 No stop-loss
🔹 Risking too much capital
🔹 Chasing late breakouts
🔹 Trading news without plan
🔹 Ignoring volume signals
🔹 Trading without chart structure
Avoid these and your win percentage naturally improves.
17. How to Build a Daily Trading Routine
Successful intraday traders follow routines:
✔ Pre-market preparation
✔ Identify key levels
✔ Mark support/resistance
✔ Check news calendar
✔ Define risk per trade
✔ Journaling after closing
Discipline is what turns strategy into consistent profits.
18. Why Technical Analysis Works (The Psychology Behind It)
Markets aren’t random — they are human behavior aggregated.
Technical analysis works because:
✔ Traders react the same way to levels
✔ Psychology repeats patterns
✔ Algorithms follow human bias
✔ Fear & greed influence price
It’s not magic — it’s collective emotion encoded in price.
19. How to Practice Technical Analysis Daily
Practice improves pattern recognition.
Try:
✔ Paper trading
✔ Chart observation sessions
✔ Backtesting systems
✔ Reviewing wins & losses
Keep improving your edge.
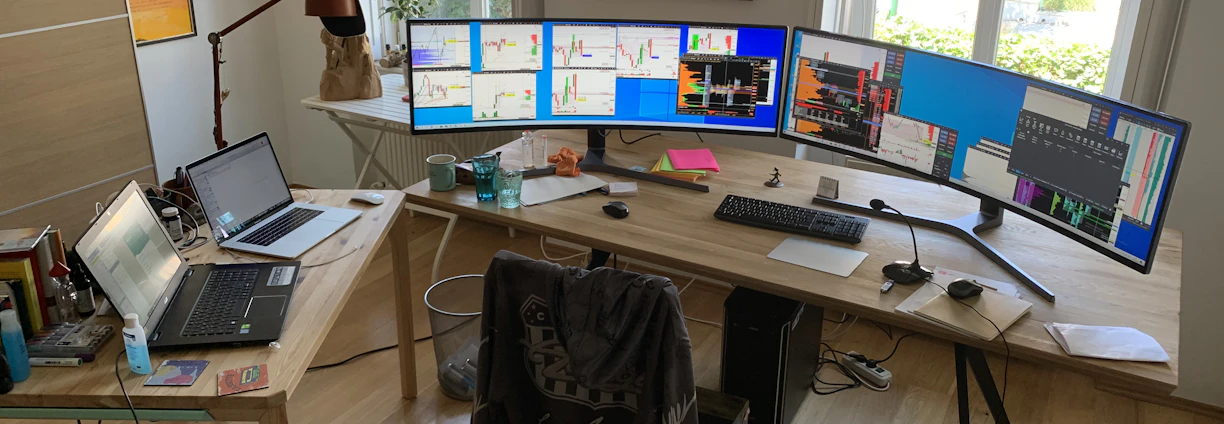
20. Tools Every Intraday Trader Should Use
Essential tools:
📊 TradingView
📈 Backtesting software
🧮 Risk calculator
📆 Economic calendar
💻 Fast execution platform
📓 Trading journal
These build speed, confidence, and accuracy.
Conclusion: Mastery Comes from Consistency
Technical analysis is not an art or opinion — it’s pattern recognition backed by rules.
From stocks to crypto, the same wheel of technical signals, volume, structure, and psychology repeats.
If you:
✔ Study charts seriously
✔ Use structured rules
✔ Practice risk management
✔ Develop execution discipline
✔ Journal and improve
You can become a consistent intraday trader in any market.
CTA: Start Your Technical Trading Journey Today
Ready to move from confusion to clarity?
🔥 Explore our step-by-step trading guides
🔥 Learn risk management systems
🔥 Get practical chart analysis examples
🔥 Build consistency with proven setups
👉 Visit TradingTechPlus.blog — where structured learning meets real market execution.
Our Services
Clear, practical insights to master technical analysis and trading strategies.


Chart Patterns
Step-by-step guides to recognize and use key chart patterns for smarter trades.
Risk Control
Practical tips on managing risk and protecting your capital in volatile markets.
Who We Are
At tradingtechplus, we make financial markets understandable for traders of all levels through clear, practical insights.
Our Mission
Our Focus
We help you master technical analysis, risk management, and modern trading tools with straightforward guides and real-world cases.
@(Hello@tradingtechplus.blog)/2026/ All rights reserved.
Contact For Any Qns Or Concerns @
TradingTechPlus.blog provides educational content only. We do not offer financial advice, investment recommendations, or trading signals. Readers should conduct their own research before making any financial decisions.
Suggested Disclaimer:
REAL EDUCATION ! YOUR WINS !